- /
- /
- /
Howto run the demo project: Explanations
This tutorial will explain the basic configuration and ideas behind the demo project. It will enable you to understand how the MapRender actually works (on a basic level). If you have not yet completed the Howto run the demo project tutorial, now would be a good time to do that.
First things first: what is actually used?
The demo project has already bundled and configured all required resources to make the first step as easy as possible. But let’s have a look at what is actually used by the MapRender.
Every MapRender run needs at least three things:
- Configuration file: the configuration file tells MapRender what to do, where to look for the required resources and how to store the rendered tiles.
Among other things it defines the
– datasources
– location of the symbol files and fonts
– rendering stylesheet
– render area
– render zoom levels
– output formats
– webserver configuration - Datasources and resources: the data storage used to get all the information required for rendering. Most likely this will be a PostgreSQL database, but there are also other possibilities.
MapRender currently supports multiple datasources, like for example:
– Database connection
– Database cache files
– Slippymap compatible folder structure
– SRTM files
– Folder with symbol files
– Folder with font files - Render stylesheet: the mapnik compatible XML rendering stylesheet. It defines what to render and how to render it.
All these resources and configurations are hold together by the configuration file:
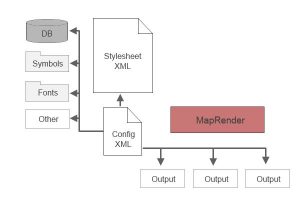
Configuration relations
When you now start the rendering process by calling the MapRender Jar-file you have to provide the configuration file as a parameter. The MapRender process will then extract every information it needs for the rendering from these configuration chains. The logical flow of information during the rendering would then look something like this:
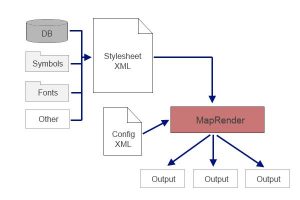
Logical information flow
The demo project uses a fairly basic set of configuration and resource files. You can find these in the following locations:
- Configuration: <maprender>/demo/config-demo.xml
- Stylesheet: <maprender>/demo/style-demo.xml
- Database Cache: <maprender>/demo/dbcache
- Symbols: <maprender>/resources/symbols
- Fonts: <maprender>/resources/fonts
The configuration file
Lets have a look at the core of it all: the configuration file. The structure of this XML file should be fairly easy to understand as it reflects the already mentioned requirements:
<?xml version='1.0' encoding='UTF-8' ?>
<maprender>
<datasource>
<dbcache>
<folder>demo\dbcache</folder>
</dbcache>
<fonts>
<folder>resources\fonts</folder>
</fonts>
<symbols>
<folder>resources\symbols</folder>
</symbols>
</datasource>
<bounds>
<boundingbox>8.3166,49.045,8.5144,48.9585</boundingbox>
<minzoom>12</minzoom>
<maxzoom>12</maxzoom>
</bounds>
<processing>
<threads>1</threads>
</processing>
<jobs>
<job name="demo">
<configuration>demo\style-demo.xml</configuration>
<output imagetype="png">
<file folder="demo\tiles\demo"></file>
</output>
</job>
</jobs>
</maprender>
You can find everything that is needed as input for the rendering process in the datasource tag. It contains the already mentioned dbcache, fonts and symbols entries pointing to the folders storing the data.
The bounds tag contains the area and zoom-levels to render. The area is defined in lat-lon-coordinates (in the order: left, top, right, bottom).
The processing tag was not yet mentioned, since it is only used for mostly optional tweeking of the internal workings of the MapRender software. In the above configuration we have configured that the MapRender should only use one worker thread for rendering. However this could have been skipped since one thread is also the default value. In general each configured thread will be responsible for one tile. So if you configure for example 5 threads you will be rendering 5 tiles in parallel. This of course only makes sense when your hardware can support this. Five threads on a single core CPU will in fact massivly slow down your rendering due to thread swapping.
Last but not least we have the jobs tag. This can contain one or more job tags. Multipe job tags can be used to split up more complex renderings into several steps with different outputs. For the demo render run we only need one which we called “demo”. This job points to the stylesheet file “style-demo.xml” which it will use and defines an output in png format that will save all rendered tiles into a slippymap folder structure with the root of the folder structure pointing to <maprender>/demo/tiles/demo.
And thats pretty much it. Every necessary resource and output is defined so we can use this to feed the MapRender process.
The start of the rendering process
To start the MapRender process you used the script file mapRender-demorender.bat (or .sh). If we look into this file we see that it basically just contains one preconfigured call to the MapRender:
“java/bin/java.exe” -Xmx8G -jar maprender.jar -c demo/config-demo.xml
The first part here is just the common way to start a java program in a Jar-File from command line: “java/bin/java.exe” -Xmx4G -jar maprender.jar. The only thing worth mentioning is the -Xmx4G part. This tells Java that the process is allowed to use up to 4GB of RAM. This is absolutely sufficient for our very small demo project. For larger render runs with multiple threads you might need to readjust this to higher values.
The second part -c demo/config-demo.xml tells the MapRender process to use the config-demo.xml file as the configuration file. This parameter is mandatory since without a configuration file the MapRender would not know what to do.
An important parameter which is not used here since MapRender can use the default setting for the demo is the parameter pointing to the license file: -l <path-to-license>.
The MapRender Zip-file comes with a bundled test-license which restricts a rendering run to 10.000 tiles. This should be plenty for testing and small projects.
If you do not specify this parameter MapRender will look into two default locations for a valid license file.
- First MapRender checks the parent folder: <maprender>/../license/license-signed.xml
- Second MapRender checks its own folder: <maprender>/license/license-signed.xml
Reason is that if you upgrade the MapRender installation to a new version you can just put your license file outside of the MapRender folder and won’t have to replace it. In our current case it will find the test-license in the second location and uses that.
A fully configured call of the MapRender could look something like this:
“java/bin/java.exe” -Xmx12G -jar maprender.jar -c ../jobs/config-germany.xml -l C:/license-signed.xml
The rendering stylesheet
The rendering stylesheet tells the MapRenderer how the resulting map should look. The color of roads, the icons of POIs, etc. The stylesheet is basically compatible with the stylesheets used by Mapnik so you can just copy paste your standard stylesheet and it should work.
In fact the stylesheet bundled into the demo project is the default stylesheet used by Openstreetmap (german style).
However not all configurations in the default stylesheet are used. All configurations in the Parameters tag are ignored or have been moved to the configuration file (bounds, zoom-levels, etc). Other entries like filters or comp-ops might not yet be fully implemented. All features in the default OSM stylesheet should work.
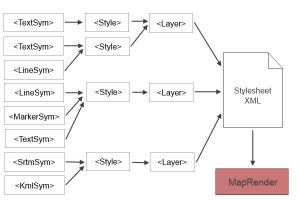
So how does this stylesheet work? Well basically it defines a lot of different layers where each layer is responsible for a certain aspect of the map like roads, city-names, oceans, etc. These layers will all be rendered separately and then be put on top of each other. Each layer defines a datasource from where to collect the data (e.g. an SQL statement selecting all road geometries). Also each layer points to one or more style tags. These style tags contain one or more symbolizers (e.g. TextSymbolizer, LineSymbolizer, PolygonSymbolizer) which are then responsible to render the geometries provided by the layer.
The benefit of this approach is that you can easily add more features like height reliefs for example between already existing layers. Also you can influence how different layers (or to be more precise: styles) will be merged onto each other be defining filters and comp-op operations on a style.
The embedded webserver
To make testing and rendering a lot easier the MapRender engine contains an optional embedded webserver. Per default this is not active so you don’t need to worry about involuntarily exposing your data in the standard setting.
However if you want to see the state of the current rendering run without having to check the logfiles or see if the currently rendered tiles look like you intended to this webserver can be very convenient.
To start it you only have to add a configuration entry into your configuration file and start the MapRender process normally. Lets have a look inside the config-demo-server.xml:
<?xml version='1.0' encoding='UTF-8' ?>
<maprender>
<server>
<run>true</run>
<daemon>true</daemon>
<port>8080</port>
<folder>demo\tiles</folder>
</server>
</maprender>
What do we see here? Basically just another tag named server where we normally would expect to see the datasource, bounds, processing and jobs tag. If you set the run flag to true (default = false), MapRender will start the embedded webserver on the defined port. If you set it to daemon to true, MapRender will not exit when done with rendering but will keep running until you end the process with CTRL-C. The folder tag defines which folder the webserver will use as a root folder. In the demo this is the directory where the output tiles will be saved into, so all tiles will be accessible in your browser via the URL http://localhost:8080/demo/<x>/<y>.png.
For the demo we have split the configuration into two files, one responsible for the rendering, the other one responsible for the server. This is not necessary and was only done to avoid accidently starting a webserver on your computer without you explicitly being aware of it. In the normal developing process you would just add the server tag to your normal configuration file and start the server with the beginning of the rendering process to be able to check in on the current status.
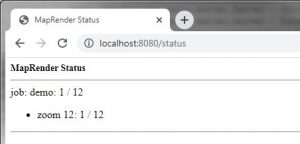
Additional to showing the rendered map the server can also show you a status overview of the current rendering run. Just call the URL http://localhost:8080/status.
The Slippymap
The demo project has a bundled Slippymap capable of displaying the rendered demo tiles. If you want to experiment a little or use the Slippymap for other maps with a different URL-path to the tiles you can do that very easily. You just have to edit the file
<mapRender>/demo/tiles/slippymap/index.js
Right in the top of the file you will find the code that adds the demo tiles to the map. If you want to add a different map you basically just have to edit the url part:
layersBase.push(new ol.layer.Tile({
title: 'Demo',
type: 'base',
visible: true,
source: new ol.source.XYZ({
url: '../demo/{z}/{x}/{y}.png',
        attributions: [

ol.source.OSM.ATTRIBUTION,

'<a href="https://www.wideportal.de">Wideportal IT Solutions GmbH</a>'

],
}),
}));
It would also be very easy to add multiple layers or overlays, but that is outside the scope of this tutorial.
Congratulations! You should now have an overview over the basic workings of the MapRender.