- /
- /
- /
Howto run the demo project
This tutorial will assume you have already downloaded the fitting MapRender Zip-file for your system. If not you can download it here.
What to expect?
After running the demo project you will have rendered your first map tiles, started an embedded Jetty webserver and accessed your rendered map in a browser.
(Note: You don’t need any prerequisites for the demo project. For example a database like PostgreSQL is not yet required. )
Step by step
- Unzip the maprender.zip
Not much more to say: choose a fitting place where you can unzip the MapRender bundle. For the demo you don’t need much space on your drive so any drive with around 500 MB of free space will do.After you have unzipped it, you should have a folder and file structure like this: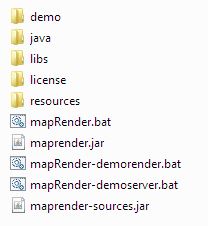
(Note: the screenshot refers to the Windows version of the MapRender Zip-file. The Linux version looks pretty much the same, just that the .bat files are replaced by .sh files.) - Open your DOS prompt or Linux shell
After you have opened your shell please go into the unzipped MapRender folder:Windows: cd <path-to-the-maprender-folder>/maprender-x.x.x-windows
Linux: cd <path-to-the-maprender-folder>/maprender-x.x.x-linux - Start the rendering
Now it is already time to start the rendering of the demo tiles. If you look into the MapRender folder you will see the script mapRender-demorender.bat (or mapRender-demorender.sh in the Linux Zip). Run it by calling it in your shell.Windows: mapRender-demorender.bat
Linux: ./mapRender-demorender.sh - Watch the logfile
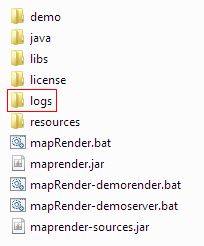
This step is of course optional. But if you want to see what is happening you can open the logfile and watch. The logfile itself is located in a newly created subfolder:../<mapRender>/logs/mapRender.log
To give you an idea what to expect here is the most relevant line of the logfile from a demo run. Of course the real logfile contains a lot more information.
09:30:04.781 [pool-1-thread-1] INFO d.w.maprender.renderer.OsmRenderer - job: demo / zoom: 12 / zoomProgress: 1 of 12, rest: ~000:00:01.459.463016 / jobProgress: 1 of 12 / totalProgress: 1 of 12 / tileIndex=Point[x=2142.0, y=1405.0] / bboxBoundingBox[left=8.26171875, bottom=49.037867945326425, right=8.349609375, top=49.09545216253481, ltrb=8.26171875,49.09545216253481,8.349609375,49.037867945326425], scaleDenom=130281.09400552028
This log line indicates a rendered tile. It also tells you additional information like the zoom level, the progress and an estimation on how long the current zoomlevel will take to finish. - Inspect the rendered tiles
After the MapRender run is finished you should now have a Slippymap compatible file structure in your demo folder:.../<mapRender>/demo/tiles/demo/…
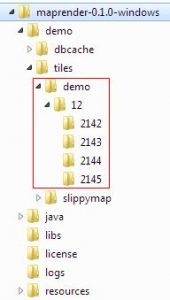
Go check this folder structure. You will see that there are now 12 PNG images in the subfolders each representing one tile.
- Whoah whoah stop. Where is the data coming from?
Anyone of you already familiar with maprendering will now of course ask how the MapRender is able to render anything without a datasource like a PostgreSQL database configured.Short answer: the the Zip-file already contains a PostgreSQL database. Well kind of.
Long answer: MapRender provides several different output formats. Normally the output format is an image file containing the rendered tile. But it is also possible to choose other output formats. One of those outputs takes the resultsets coming from an existing Database during an actual tile rendering and stores them into a cache file. This cache then contains all data needed to render this specific tile and can replace the actual database connection. This approach has it limits of course, mainly the extremly big size of these cache files. However it is a very convenient way to simplify the rendering of the demo without the need for installing an actual PostgreSQL database.
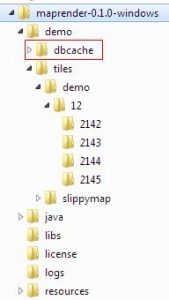
So what happend here is that in a previous and slightly different configured run of the demo project all the required database data was outputted into these cache files which now serve as an input source.
- Starting the embedded Jetty webserver
After you have rendered the tile files you might wonder what to do with them. For a working online map you have to make these files accessible via webserver.For testing purposes MapRender comes with an embedded Jetty webserver that can be used to access these tile files via browser. Starting it is as easy as starting the render process. You just have to call a provided script file:Windows: mapRender-demoserver.bat
Linux: ./mapRender-demoserver.shWhat this does is that it will start the webserver with the folder <maprender>/demo/tiles as root folder. This means that all files and folders located in this directory will be accessible with a browser. As you might have already noticed the folder <maprender>/demo/tiles also contains a subfolder slippymap which will be used to display the map.
(Note: Slippymap is a javascript based framework running in your browser that handles all the usability stuff of the map like zoom, panning, etc)
- Access the Map in your browser
After you have started the embedded webserver you can now access the rendered map in the browser of your choice. Just open your browser and surf to: Congratulations! Your browser should now display the rendered map of Karlsruhe in zoomlevel 12.To stop the server again you have to stop the process in your shell via CRTL-C.
(Note: please make sure to allow Javascript in your browser otherwise the map cannot be displayed)